Market Overview
We believe fundamentals drive long-term returns. Despite some ongoing worries about the pace of global growth, we think fundamentals are still supportive overall. Stay positive and keep long-term prospective!
US Economics
The nation’s economic locomotive slowed down a bit in the first quarter of this year. Major growth engines like employment, new home sales, industrial production and business fixed investment hardly advanced. By the looks of it, GDP is up by no more than 1.0%-1.5% this quarter – a far cry from results achieved in 2018. Will we be stopping with a screeching halt? In the short run, seasonal factors should kick in, and that could produce better readings in job growth, retail sales, industrial output, and housing. It may be hard to re-accelerate to the 3%-4% rate of growth seen over the final nine months of 2018. However, we think the economy can rebound later this year, perhaps to a range of 2.0%-2.5%. With the employment participation rate on the rise (more people coming back to work force), we see the economy being able to sustain lower unemployment rates without overheating. One should also remember that a yield curve inversion happens on average 18 months ahead of a recession and none of the last eight downturns started with real rates lower than 2%. A US recession has never started while unemployment rate was falling either.
Global Economics
We think global economic growth should rebound somewhat over the course of 2019. US-China trade talks are progressing with the two sides aiming to achieve a deal by late April. Combined with the Fed pausing its rate hikes and China’s tilt to fiscal easing, global financial conditions have become more accommodative. Europe’s latest political and economic situation makes the region a major risk factor for the world. Nevertheless, the Euro area is still expected to grow this year by more than 1% according to European Commission. Moreover, labor markets remain very strong in key regions of the world, with rising wages. Emerging economies should get support from rising energy and commodity prices.
Equity returns and margins
Today a question on investors’ minds is particularly acute: Are corporate profit margins too stretched? Rising commodity prices such as oil and industrial metals, in addition to rising wages, are commonly seen to be headwinds for profit margins. The problem with this view is that historically oil prices and PPIs show a strong positive correlation to both top-line earnings and to profit margins according to JP Morgan. Therefore, we don’t view the current rising commodity prices as a headwind for corporate margins. Moreover, wages also don’t display a straightforward inverse correlation to profit margins. In fact, in the last 10 years wages and US margins were positively correlated, and the unemployment rate has historically been inversely correlated to profit margins. There is a very clear positive correlation between margins and real GDP growth, PMIs and many other macro momentum variables. Within this positive correlation, JP Morgan finds a threshold of around 2% real GDP growth in the US, below which margins tended to contract, and above which margins were expanding. In Eurozone this threshold was around 1% GDP growth.
Low Growth World
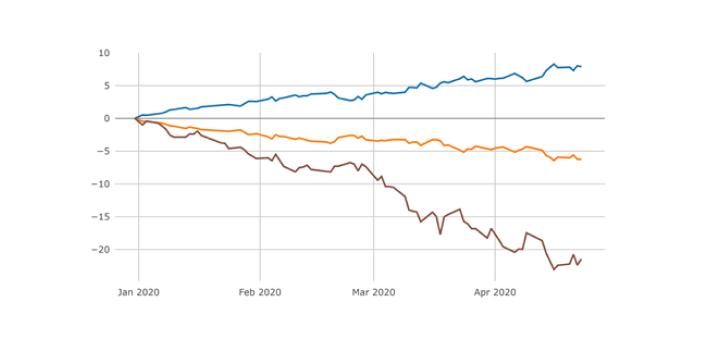
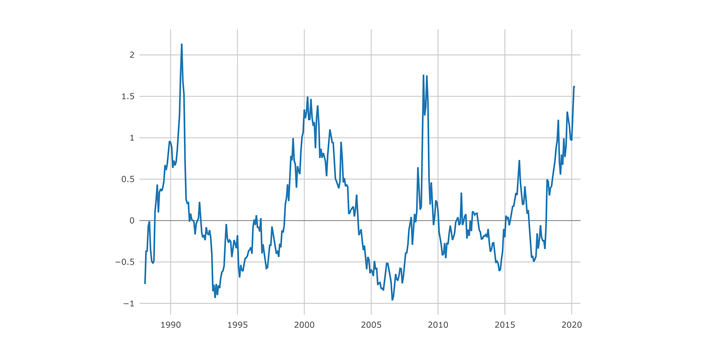
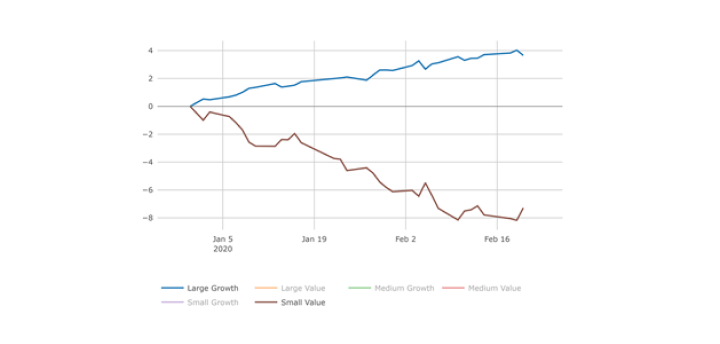
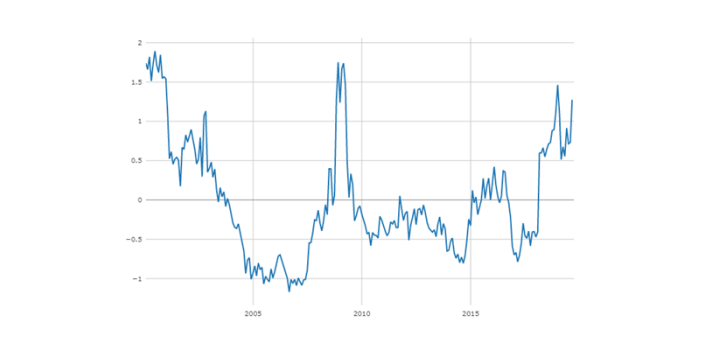
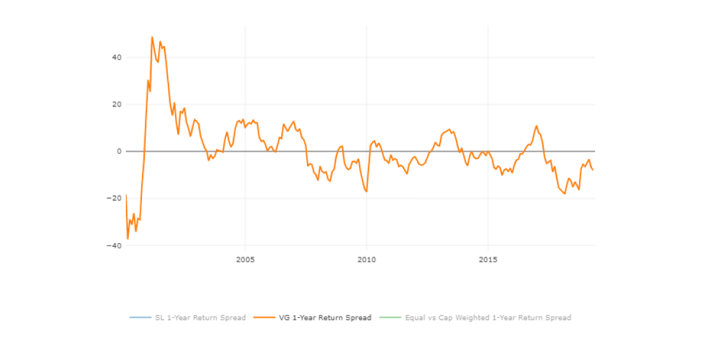
In a lower growth world, with consistently falling bond yields and a slow and long recovery cycle, growth has outperformed value and defensive sectors have outperformed cyclicals. These strategies and sectors, however, have become expensive relative to history. In our previous newsletter we talked about the Valuation Spread and how it spiked last year on concerns about the future of the economy. Expensive stocks became even more expensive in comparison to cheap ones to the magnitude comparable to the great recession (2008-2009) and IT bubble periods (1998-2000).
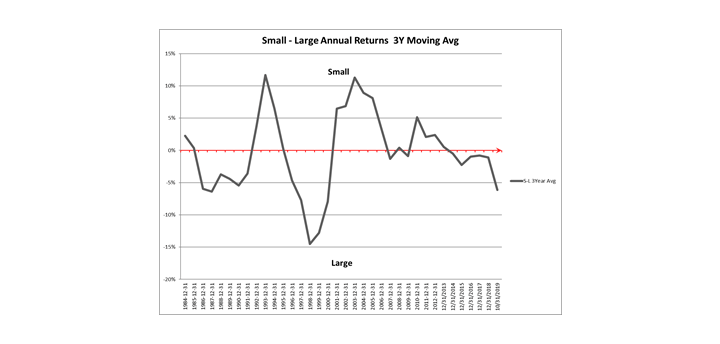
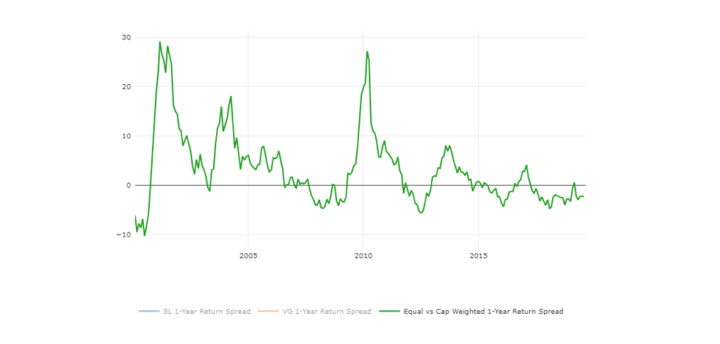
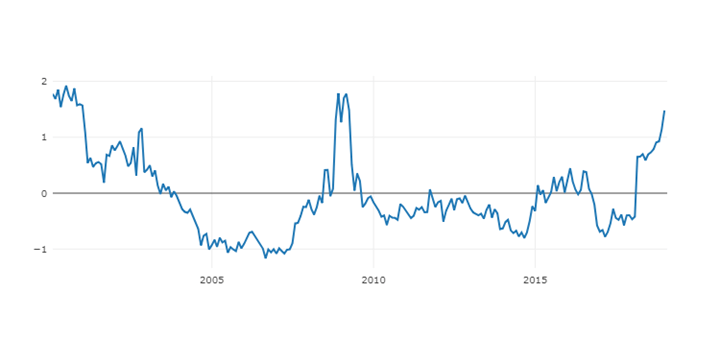
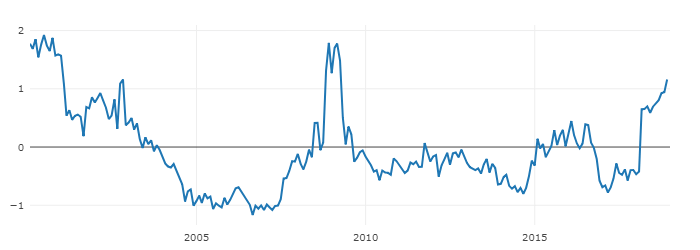
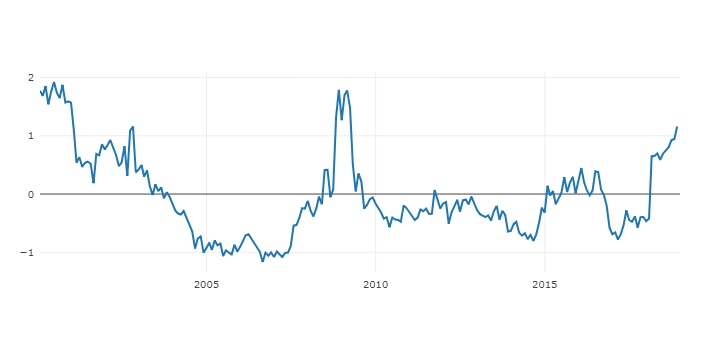
Moreover, over the last few years the market was spooked by the prospects of a recession several times (mid 2015-mid 2016, 2018). During those periods, the market was relatively narrow i.e. driven by one theme. Defensive stocks and mega caps prevailed in 2015-2016 and a concentrated group of mega cap stocks with inflated valuations in 2018. Those two episodes are very similar. See the chart below. If you look at the long-run though, you can see that the equal weighted approach usually prevails. In the equally weighted regime it is easier to be selective and compose a portfolio based on broad group of fundamentals and not one particular aspect, be it safety, sales growth, or size.
At Signet FM, we always pay attention to a broader group of fundamentals, which are important for a long-term stock returns. We adhere to our long-term discipline through favorable and unfavorable short-term market conditions. By doing so we avoid chasing unsustainable trends and getting whipsawed when the market re-embraces fundamentals.
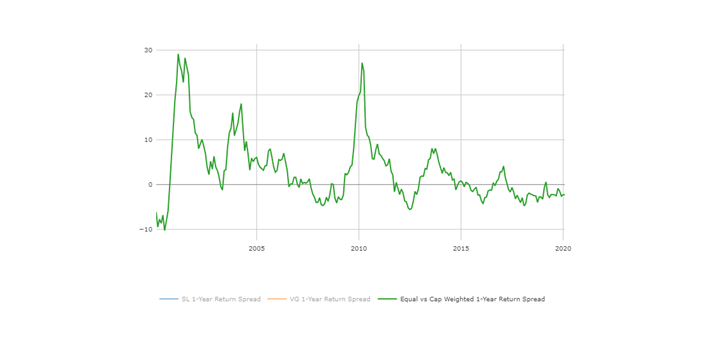
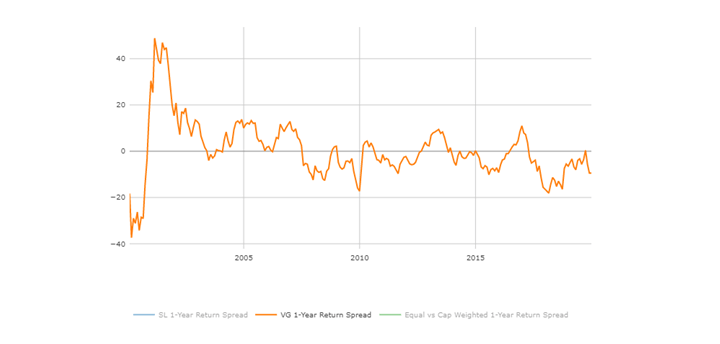
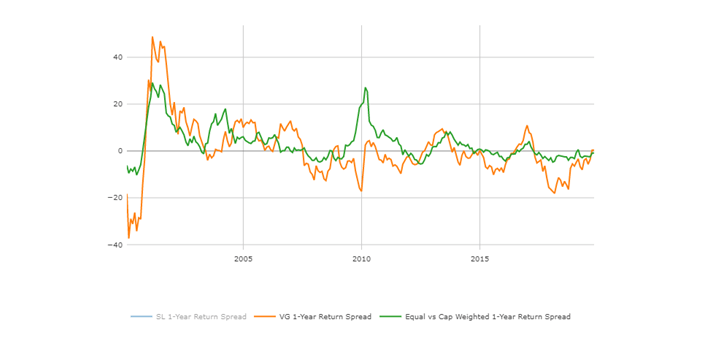
Equal vs. Market Cap Weighted 1-year Return Spread through February 2019:

Y axis – Equal vs. Cap Weighted 1-Year Return Spread based on Signet’s stock universe; X axis – years;
The information and opinions included in this document are for background purposes only, are not intended to be full or complete, and should not be viewed as an indication of future results. The information sources used in this letter are: WSJ.com, Jeremy Siegel, PhD (Jeremysiegel.com), Goldman Sachs, JP Morgan, Empirical Research Partners, Value Line, Ned Davis Research, Citi research and Nuveen.