US Economics
The economy continues to chime along, providing some stability, which is rather reassuring. Key economic reports provide conflicting signals but nevertheless continue to project a partial recovery in the final half, with GDP, which tumbled in the second quarter, likely rebounding off that low base in the second half of the year. The Federal Reserve provides another level of support, with the bank leaving little doubt it is committed to keep interest rates low and is ready to inject further large sums in support of the evolving economic recovery.
Goldman Sachs think it is now clear that Congress will not attach additional fiscal stimulus to the continuing resolution. This implies that after a final round of extra unemployment benefits that is currently being disbursed, any further fiscal support will likely have to wait until 2021. They estimate that the withdrawal of fiscal support will reduce disposable income in Q4 to roughly the pre-pandemic level. This will weigh on consumer spending, but probably by less than initially feared. Seven weeks after unemployment benefits lapsed, timely spending measures have trended higher, reflecting an offset from ongoing adaptation and reopening in the service sector. So, while it looks like GDP will shrink in 2020 by 3-4%, it should bounce back vigilantly in 2021 – Goldman estimates +5.8% annual growth.
Global Economics
Global growth has moderated from its torrid midyear pace, but incoming news suggests we are ending the current quarter with strong momentum. This is the message from August reports showing broad-based Chinese growth and solid gains in US consumption — led by a rebound in services spending at restaurants and bars — and manufacturing. JP Morgan projects global GDP next quarter to stand 2.2% below its 4Q19 level and 4.7% below the level they had projected at the start of this year. This highlights two outlook issues. First, despite the recent good news, the historic 1H20 collapse in activity will require sustained robust global growth to achieve a full recovery. Second, sustained depressed employment, profits, and inflation will slow the recovery, as will fading policy supports. Central to an incomplete recovery through next year is the view that policymakers are unwilling or unable to respond to the coming growth and inflation shortfalls.
Stock Market
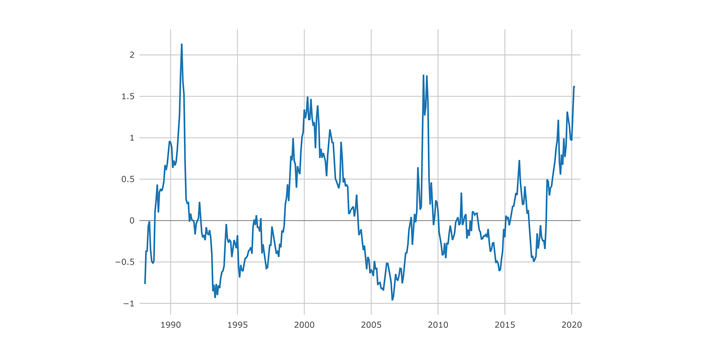
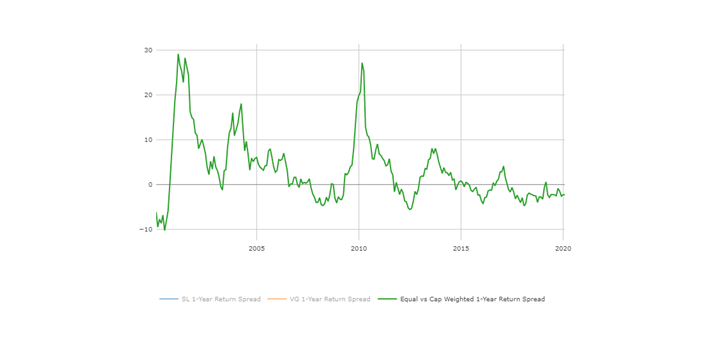
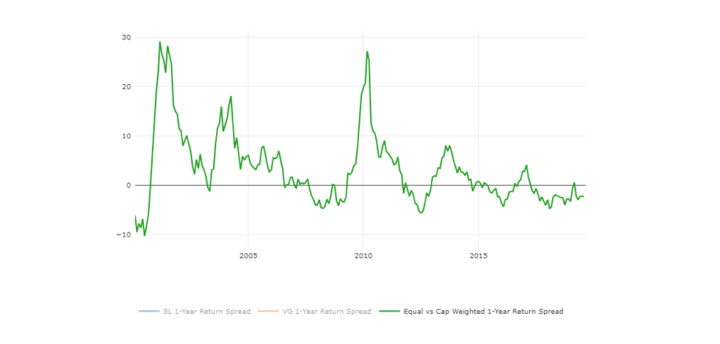
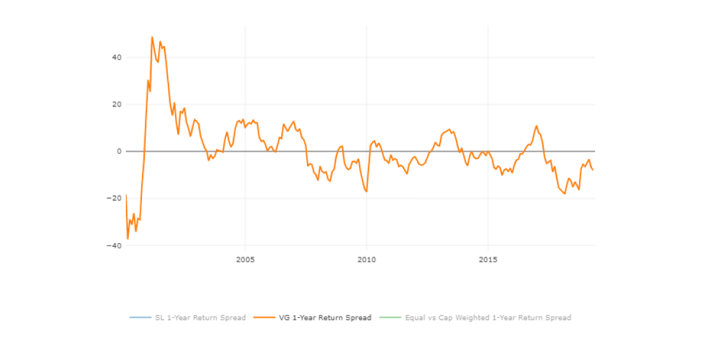
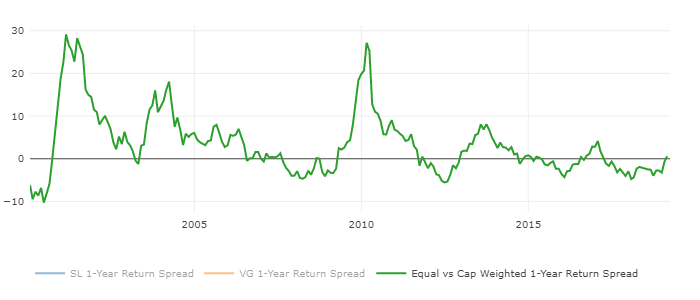
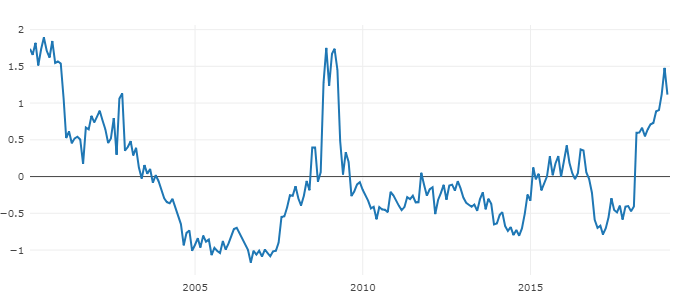
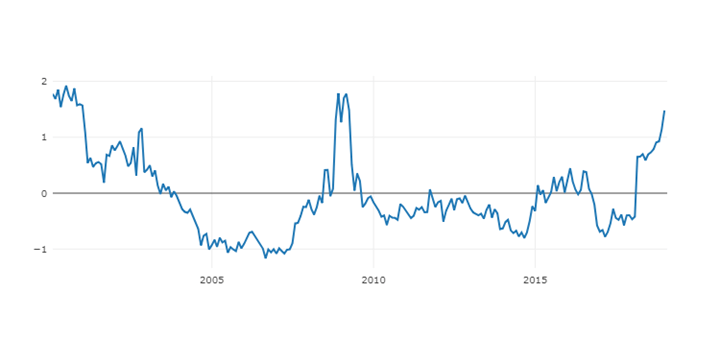
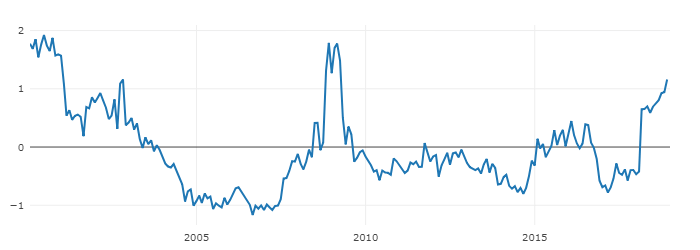
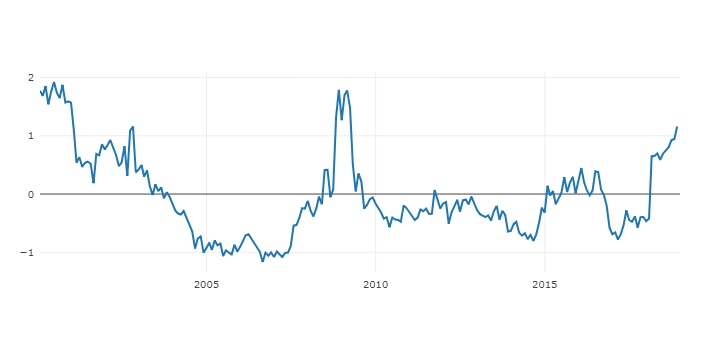
Valuation Spreads (the difference between expensive and undervalued stocks) (see VS Graph below) are still very high. Market concentration is at historic highs as well. The five largest companies comprise 23% and 39% of the capitalization of the S&P 500 and Russell 1000 Growth indices, respectively. AAPL, MSFT, AMZN, GOOGL, and FB have returned 40% YTD compared with 5% for the S&P 500. (see Equal vs. Market weighted Chart below). The first 20 companies in S&P 500 constitute almost 40% of the weight in the index one of the highest readings ever.
Per extensive research from Research Affiliates and Goldman, index leadership is difficult to maintain. The list of companies comprising the top positions in indices is not immutable. Index membership fluidity stems from the survivorship bias inherent in their design. Underperforming firms decline in weight or may be removed altogether and are replaced by newer, faster-growing constituents. The five largest stocks by market cap in 2000 accounted for 18% of the S&P 500 but today those same firms comprise just 8% of the index. In contrast, 20 years ago the current five market leaders represented just 3% of the S&P 500 vs. 23% today. Only one of the five largest stocks in 2000 remains on the current list (MSFT) while the fifth-largest stock today (FB) was not even a member of the index until eight years ago.
The S&P 500 has posted 4% annualized revenue growth since 2009 while FAAMG grew its aggregate top-line at a 20% cyclically adjusted growth rate. The ability of these firms to grow sales rapidly regardless of the economic situation has been brought into focus by the corona crisis and has reaffirmed their label as “secular growth” stocks. Growth is particularly important with interest rates at the lower bound. As we mentioned in our previous newsletters, high flying growers have been traded as one cohort at the moment, but historically the high expectations towards continued growth is only realized with one third of them.
Although Value rebounded in August (see Factor Heat Map below), the growing number of virus cases, impasse on additional stimulus and upcoming elections weighted on the stretched markets in September. We believe we are paid to take a bit of a contrarian approach with valuation discrepancies and continue loading on some “back to normal” stocks, which used to be extremely profitable in normal times and could resume this path in the future. Examples of such industries are energy, telecommunications, consumer durables and some retailers. We keep our barbell approach for now with a neutral posturing in Growth and Value.
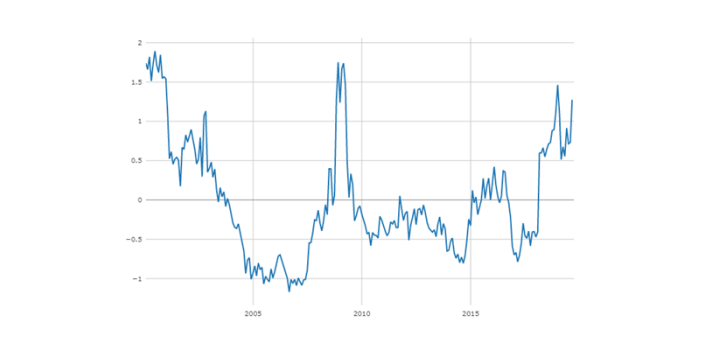
Valuation Spreads (Source – Signet FM): through August 2020

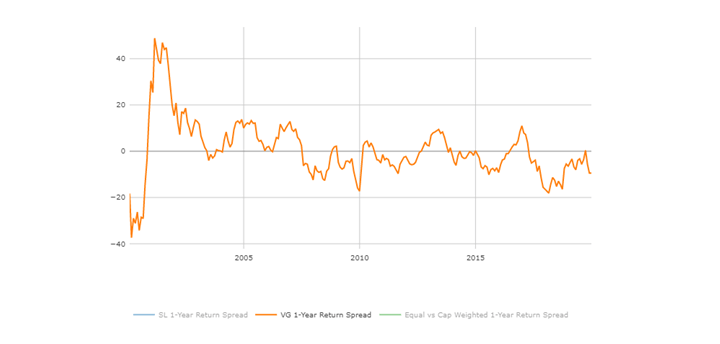
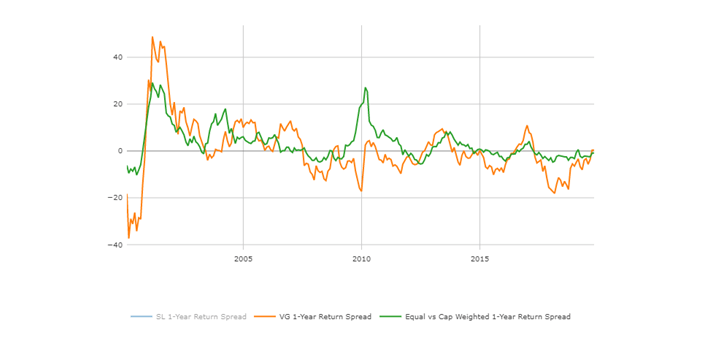
Equal vs. Market Weighted 1 Yr. Return Spread (Source – Signet FM): through August 2020

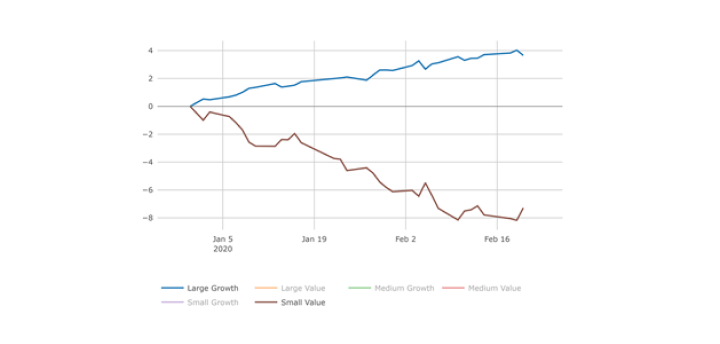
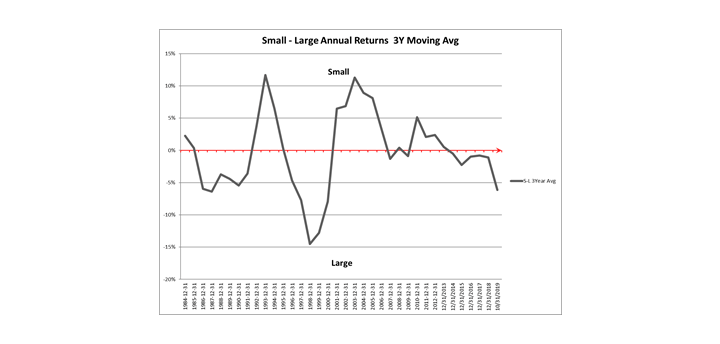
Large vs. Small and Growth vs. Value 2020 YTD (as of 09/24/2020) (Source – Signet FM):

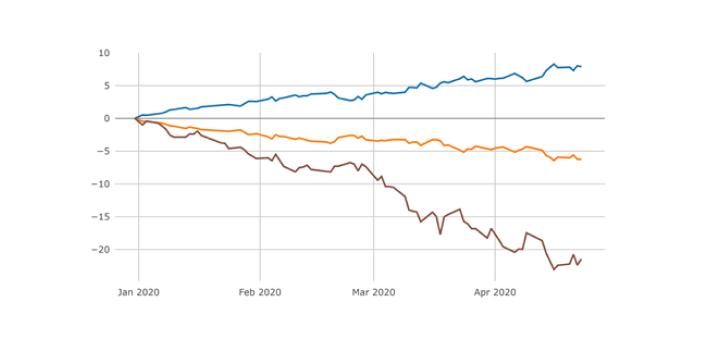
Factor Performance (Top 2 quintiles of Large Cap Universe vs. SP 500) (Source – Signet FM):