US economics, inflation, and the Fed
Recent economic data has largely been positive, with inflation rates cooling. Over 12 months, the Consumer and Producer Price Indexes have decreased from their 2022 peaks. The latter is close to the Federal Reserve’s 2.0% growth target. Treasury market yields and the value of the U.S. dollar retreated on the price data, giving a boost to equities. A strong consumer, backed by a solid job market, reduces fears of a major economic downturn.
Notably, early July saw a significant rise in consumer confidence, as reported by the University of Michigan. Gross domestic product grew at a seasonally and inflation-adjusted annual rate of 2.4% in the second quarter, picking up slightly from 2% growth in the first three months of the year, the Commerce Department said on July 27th.
The Fed raised the federal funds rate by a quarter point, to 5.25%–5.50%, at the meetings concluded on July 26th. Beyond that, according to Value Line, the central bank should be wary of overtightening the monetary reins and hurting the consumer and labor sectors. While not totally abating his previous position (that the Fed should stop hiking interest rates), Professor Siegel of Wharton Business School points to the fact that the Fed is not as tight as he feared:
“We are now starting to see the money supply recovering. Last month, it ticked higher; I watch weekly deposits and it looks like when the data comes out this week, it will again grow. This is one big factor causing me less angst. Secondly, housing prices, which soared during the money supply explosion in 2020-2021 and started falling when the money supply first contracted, have turned the corner the last three months. I’m not going to say housing price increases are a permanent trend change with 7% mortgage rates, but we’ve had a consecutive string in housing price gains in both Case-Shiller and other national housing price indexes. We will get more data on both the M2 money supply and housing this week, but forecasts are for increases in both. Thirdly, commodity prices, which are extremely important because they are very sensitive to economic growth pressures, look like they’ve bottomed and ticked up again. The Bloomberg Commodity Index, which plummeted 20-25% in May from the highs, has firmed recently. Those three indicators imply the current real rates and the Fed rate path projection is not excessively high”.

Global economy
J.P. Morgan anticipates that the global expansion survives a significant sectoral rotation in the second half of the year. Fading post-pandemic normalization should cool services spending and slow employment, which continued rising a full percentage point above its pre-pandemic pace in the first half of 2023. Monetary restraint should continue weighing on interest-sensitive spending. However, moderating finished goods price inflation should combine with labor income gains to sustain goods spending and induce a manufacturing renaissance.
Overall, it appears that output is stabilizing, and final demand is generating modest growth at midyear, buoyed in part by rising consumer confidence. This suggests a lingering drag from slowing stock building should be close to an end. Nevertheless, business surveys point to still-depressed new orders and expectations, which could result in a potential slowdown in the U.S. and Western Europe in the second half of the year.
Earning season and the stock market
The second-quarter earnings season began well. Results from major banks were favorable, showing profit increases and few concerns. Overall, the current expectation is that earnings for the S&P 500 companies fell about 7% in the second quarter, which would mark the third-straight quarterly decline in profits.
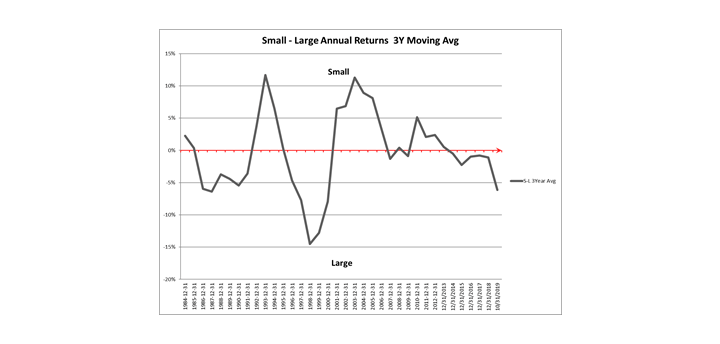
Despite falling profits, the market has been on a steady rise in 2023 driven by a small group of mega caps. The recent rise in market cap concentration has been the steepest on record based on 60+ years of history with even narrower leadership than seen during the Tech Bubble according to J.P. Morgan.
There is an extreme divergence in index weight concentration in mega caps vs. the next tranche of large caps (largest 10 stocks at 83%ile of index weight within S&P 500 vs. the next 40 stocks at 18%ile in 60 years of history. Year to date six mega-cap companies — MSFT, GOOGL, AMZN, META, NVDA, and CRM — explain 51% of S&P 500 performance, 54% of Nasdaq 100, and 63% of the Growth factor.
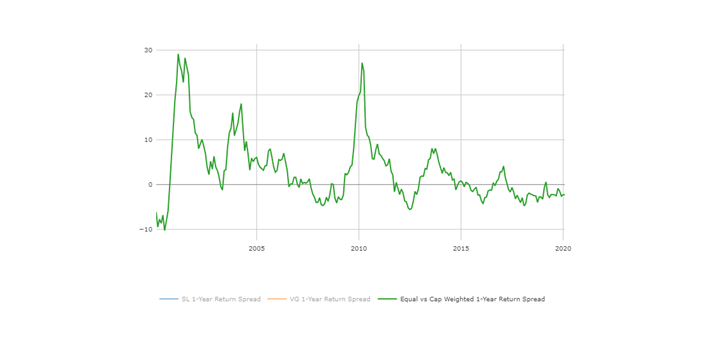
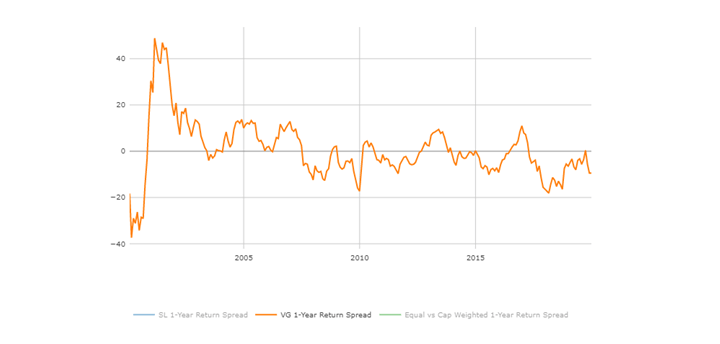
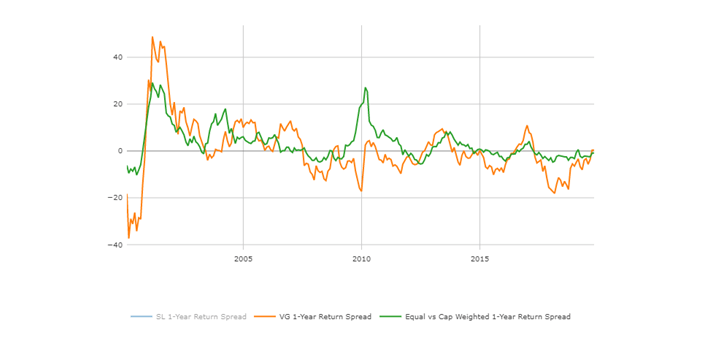
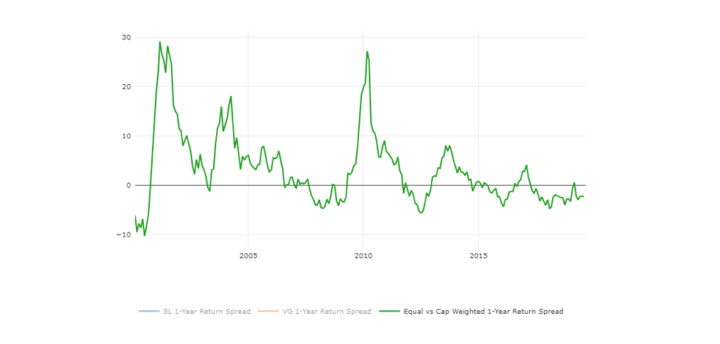
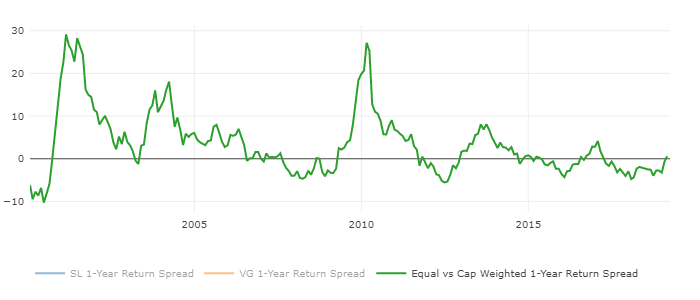
In the past, a steep rise in concentration and narrow leadership has always reversed with S&P 500 equal-weighted index outperforming the market-cap weighted index according to J.P. Morgan. While it is hard to predict a catalyst — an inflation shock with surprise rate hikes or a sharper contraction in the global central banks’ assets or a hard landing — any of these could trigger a significant reversal.
Empirical Research Partners point out that given the returns in the last year, it’s sensible to look outside the GARP sphere for new ideas. On the value front, some of the financials sit in the market’s lowest decile of P/E multiples, a starting point that’s been a winner in 55% of all months. The key to that idea working out is avoiding a credit cycle. In addition, valuation differentials within the energy sector have widened this year and are now back to an average level. The stocks are priced to a trailing free cash flow yield of 11%, +7 points more than the market, and a record. That could be an opportunity. Much the same can be said for the metals and mining stocks, that are priced to 8% free cash flow yields.
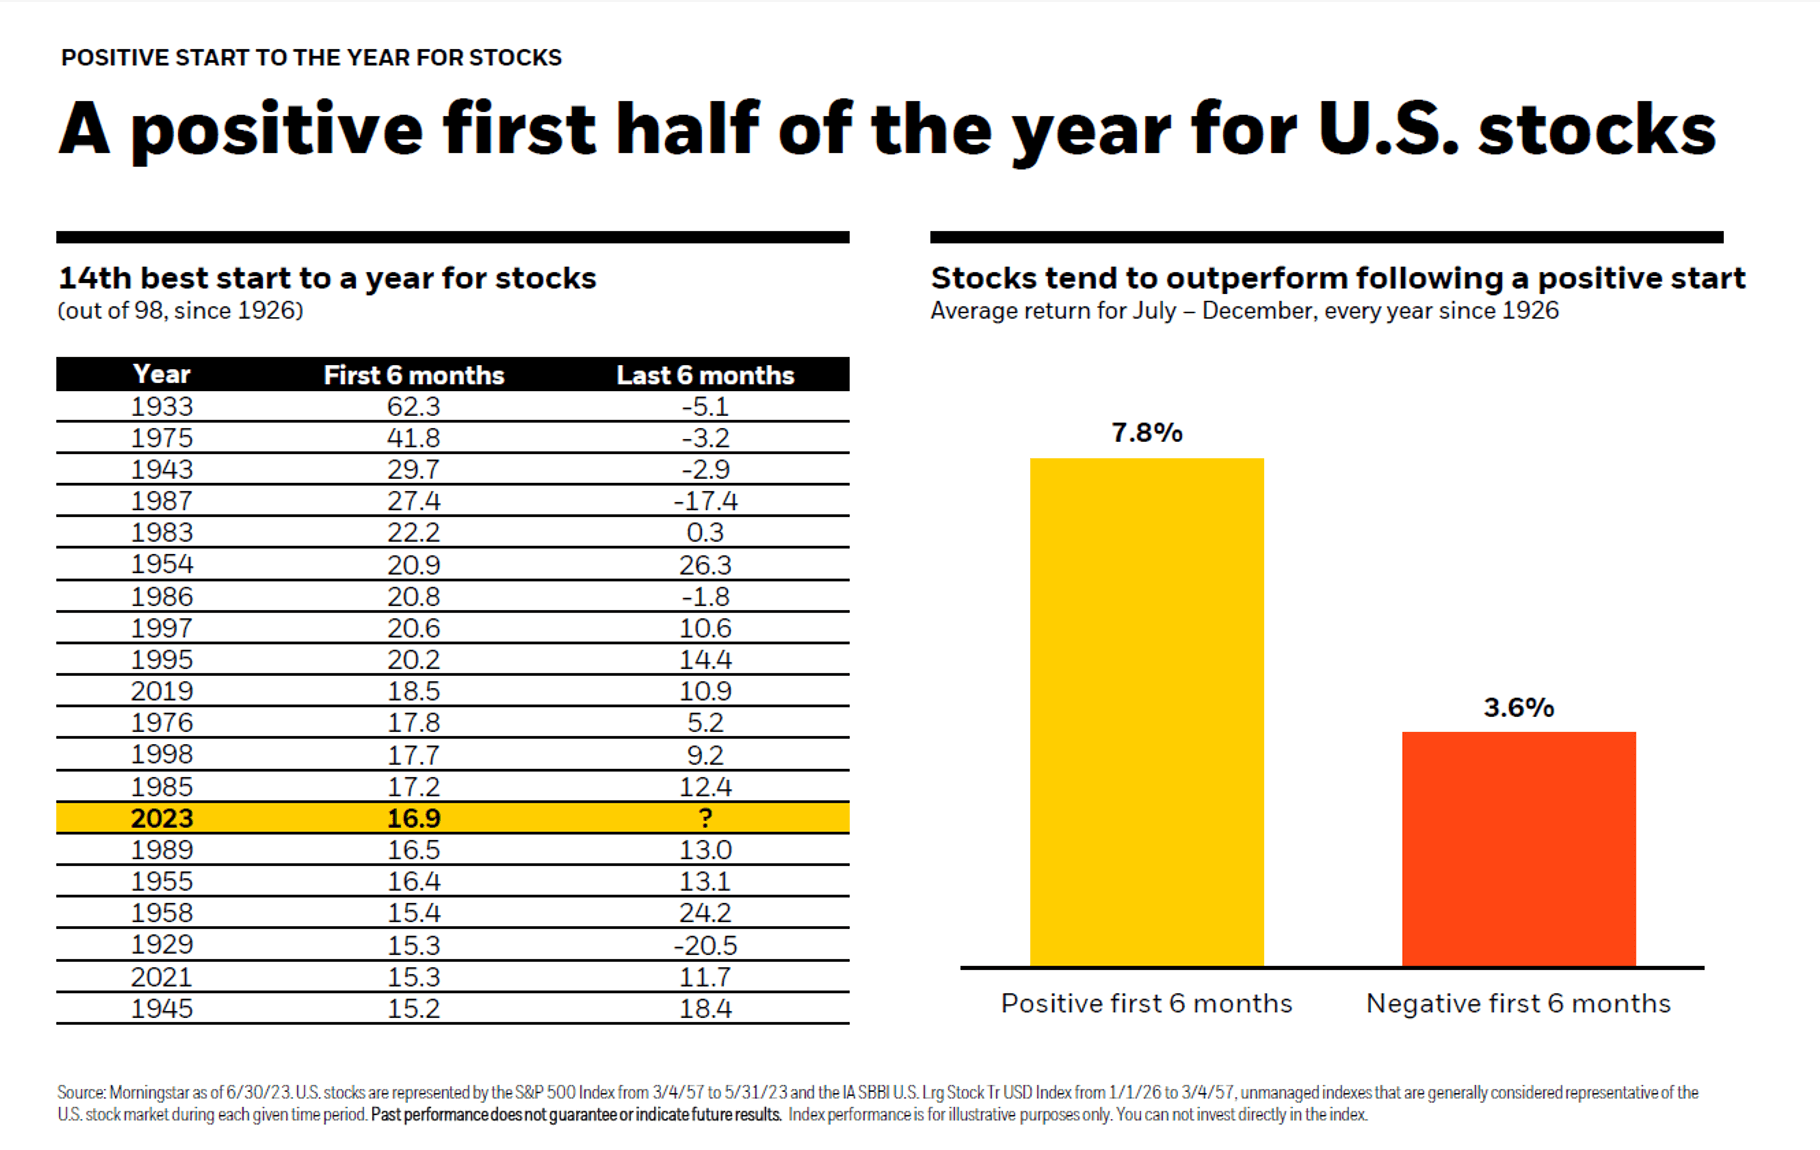
So, the broader equity markets have continued to recover from a difficult performance in 2022. However, with corporate earnings still on the decline and the Fed maintaining its hawkish monetary stance, the Signet investment team recommends holding stocks of high-quality companies. According to BlackRock, the market is more likely to advance in the second half of the year if history is any indicator.
The information and opinions included in this document are for background purposes only, are not intended to be full or complete, and should not be viewed as an indication of future results. The information sources used in this letter are: WSJ.com, Jeremy Siegel, Ph.D. (Jeremysiegel.com), Goldman Sachs, J.P. Morgan, Empirical Research Partners, Value Line, BlackRock, Ned Davis Research, First Trust, Citi research, HSBC, and Nuveen.
IMPORTANT DISCLOSURE
Past performance may not be indicative of future results.
Different types of investments and investment strategies involve varying degrees of risk, and there can be no assurance that their future performance will be profitable, equal to any corresponding indicated historical performance level(s), be suitable for your portfolio or individual situation, or prove successful.
The statements made in this newsletter are, to the best of our ability and knowledge, accurate as of the date they were originally made. But due to various factors, including changing market conditions and/or applicable laws, the content may in the future no longer be reflective of current opinions or positions.
Any forward-looking statements, information, and opinions including descriptions of anticipated market changes and expectations of future activity contained in this newsletter are based upon reasonable estimates and assumptions. However, they are inherently uncertain, and actual events or results may differ materially from those reflected in the newsletter.
Nothing in this newsletter serves as the receipt of, or as a substitute for, personalized investment advice. Please remember to contact Signet Financial Management, LLC, if there are any changes in your personal or financial situation or investment objectives for the purpose of reviewing our previous recommendations and/or services. No portion of the newsletter content should be construed as legal, tax, or accounting advice.
A copy of Signet Financial Management, LLC’s current written disclosure statements discussing our advisory services, fees, investment advisory personnel, and operations are available upon request.


